:format()//media/Data-Analytics-in-Higher-Education_RQ.png)
"Data! Data! Data! I can’t make bricks without clay!" Sir Arthur Conan Doyle (Sherlock Holmes, The Adventure of the Copper Beeches)
Even the world’s most famous detective needed data to unmask his villain so why is it in a world filled with mounds and mounds of relevant and usable data so many of us are choosing to go it alone?
In January of this year, the Higher Education Commission (HEC) published their report "From Bricks to Clicks: The Potential of data and analytics in higher education. The report sets out in no uncertain terms how the use of big data and digital technologies can have an impact on higher education and it ably demonstrates the powerful role analytics can play in enabling universities to achieve their strategic goals and to help students to maximize their potential.
The "bricks to clicks" report explores the idea that the volume, velocity and variety of data that we now generate as digital consumers is increasing at an enormous rate. This data footprint has huge potential to be analysed to provide powerful insights into one’s behaviour, our preferences and how we act into the future.
With regards to higher education, in particular, students are leaving a data footprint behind in the course of their study which tells us about their learning habits and experiences at university.
Universities can (and definitely should) use this data to understand how students learn and optimize the student experience (learning analytics).
The major motivations for introducing learning analytics include:
- Increasing retention
- Providing better feedback to students
- Capturing attendance data
- Enhancing teaching and learning
What kind of data can we analyze?
- Timetables
- Administrative data
- Research data
- Financial data
- Planned work
- Student and performance data
- Staff data
- Environmental data
- Alumni and historical data
So how are data analytics and higher education getting along? Are colleges and universities actually gathering and analyzing this data to inform future decisions?
According to the report a survey conducted by the Heads of E-Learning Forum (HeLF) in June 2015 found that nearly half of UK HEIs have not implemented learning analytics at all.
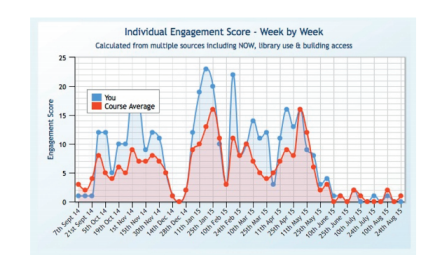
Nottingham Trent University’s Student Dashboard
So who is using learning analytics and what benefits have they found. The report makes an in-depth case study of Nottingham Trent University and examines the role Learning Analytics plays in their institution. Nottingham Trent is one of the current sector leaders in the area and was the first institution in the UK to develop and roll-out a student dashboard.
The university cites three factors behind their decision to create the dashboard:
They first ran a HEA-funded project from 2008-2011 focusing on student retention and engagement called HERE – Higher Education & Retention).
Next they worked with several external vendors to test how viable it would be to implement learning analytics.
Lastly, they conducted an audit internally which uncovered that while the institution was performing well on retention there was room for improvement when it came to sharing data and using data to inform interventions.
The HERE project found that up to one third of students had considered leaving university at some point during their first year and while most of these students remained in higher education they reported feeling more distant from their tutors and peers, found their courses less satisfying and struggled to cope with their studies undoubtedly leaving them at an increased risk of withdrawal or failure than the remaining two-thirds of their peers.
(Source: From Bricks to Clicks report)
Based on this statistic the university developed the dashboard to improve student’s sense of belonging to their course and to help them develop strategies to help them achieve. Students of the university are encouraged to log in to the dashboard to see how they are doing in comparison to their peers and are encouraged to use the dashboards in their everyday lives.
The dashboard measures campus swipes, library use and log-ins to the virtual learning environment as well as attendance and use of e-books. The dashboard enables students to take more control of their studies, test their current engagement levels, and see how they compare to students and what they need to do to become more engaged.
The student dashboard is an incredibly valuable tool for both the university and for their students and according to the report data analysis for the period of 2013-2014 has shown a strong connection between high engagement and both high retention and high academic performance.
If you haven’t had a chance to read the full report yet it makes a persuasive case for Learning Analytics and if your university is thinking of implementing your own dashboard it’s a good place to start!